Tax

Tax season by the numbers: 2023

The verdict for this year's tax season is that it was one of the most normal in years, without any of the craziness of the first three season of the COVID pandemic, or the massive tax law changes of the few years before that — and that's all reflected in the season-ending data from the Internal Revenue Service. (See our feature story for more.)

043023-Average tax refunds2023.png
Without any pandemic-related credits available, the average refund was down by between $200 and $300 — which took many taxpayers by surprise. Overall, the IRS paid out $30.4 billion less in refunds.
043023-Total tax returns received 2023 CHART
The flow of returns into the IRS was relatively even this year, and more or less matched the pace of last year, though by April 21, the service has received approximately 2 million fewer returns than last year.
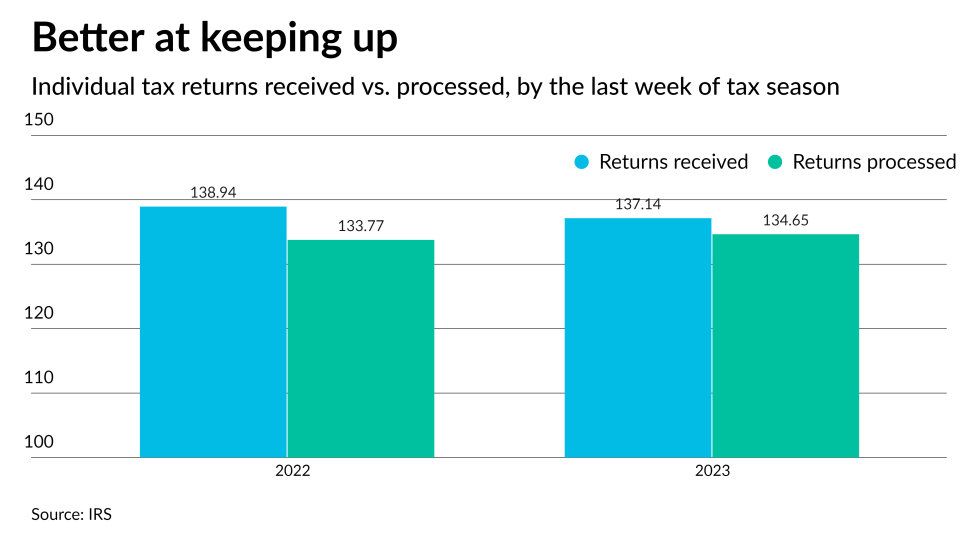
043023-2023 Tax returns received versus processed CHART
With more staff, less of a backlog, and no unusual mandates to manage, the IRS was better able to answer calls and process returns. By the end of the last week of tax season, only 1.8% of received returns had yet to be processed, versus 3.7% at the same point in 2022.
043012-DIY tax returns versus pro prepared CHART
The final stats show a complete reversal of the first month of tax season, when tax pros accounted for 43% of efiled returns, and DIY returns were at 57%.
043023- Millions of efiled tax returns CHART
While the relative proportion of returns efiled by tax pros and do-it-yourselfers was much the same as in 2022, in 2023 the IRS received 1.4 million fewer efiled returns.
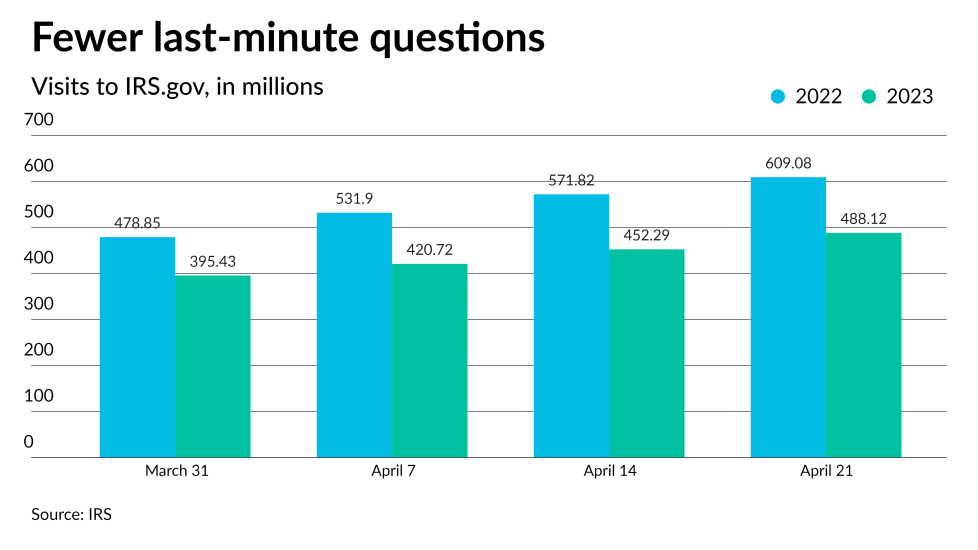
043023-2023 visits to IRS.gov CHART
One strong indicator of the greater simplicity of this season was a significant drop in the number of visits to IRS.gov right from the very beginning. And in the last month of the 2023 season, there were roughly 25% fewer visits than in 2022 (93 million versus 120 million.
MORE FROM ACCOUNTING TODAY